 Data Science and COVID-19
Welcome to the Data Science and COVID-19 project. This project analyses publicly available data from the European Centre for Disease Prevention and Control on the COVID-19 pandemic using Data Science tools and techniques.
The site includes:
- Data Science and COVID-19 Blog - discusses trends and patterns regarding the COVID-19 pandemic in terms of infection rates, etc. Also explains how you can use freely available tools to perform your own analysis of COVID data. The code and supporting scripts are all hosted on the COVID-ML github repository.
- COVID-19 Graph Repository - regularly updated graphs showing different aspects of the COVID-19 virus (infection numbers, mortality rates, Case Infection Risks etc)
Headlines
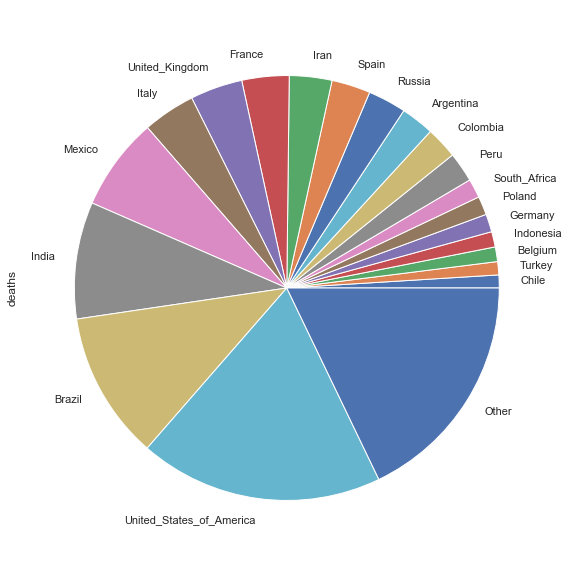
The number of officially recorded COVID-19 cases is now approaching 4 million and the number of deaths has exceeded 200,000 worldwide.
Worldwide cases: 71503614
Worldwide deaths: 1612833
Data last updated Sunday 30 May 2021 at 00:00:31
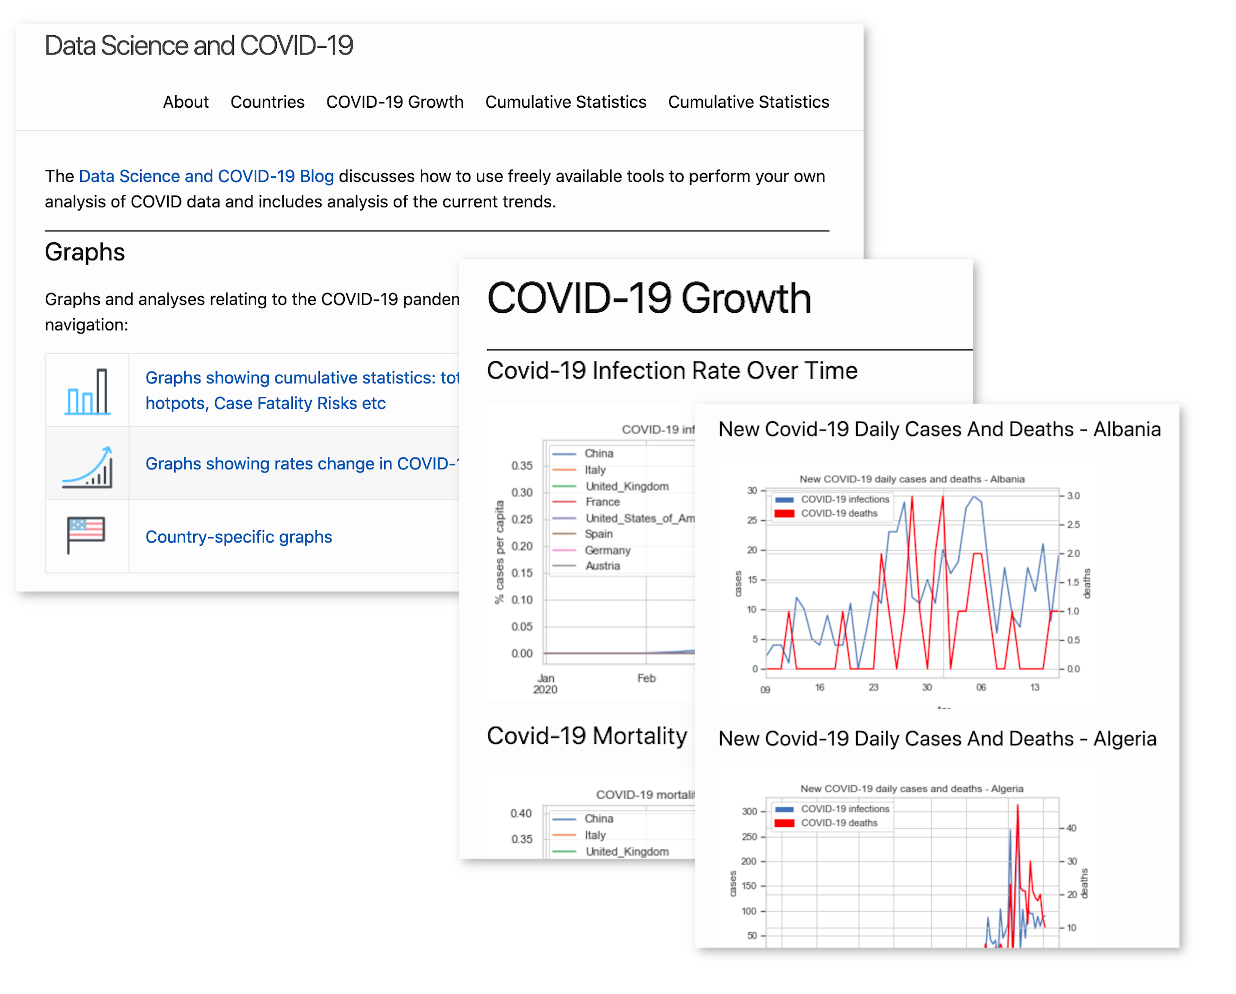
COVID-19 Graph Repository
Graphs and analyses relating to the COVID-19 pandemic are organised into categories to simplify navigation:


Data Science and COVID-19 Blog
-
Is San Marino really the centre of the coronavirus?
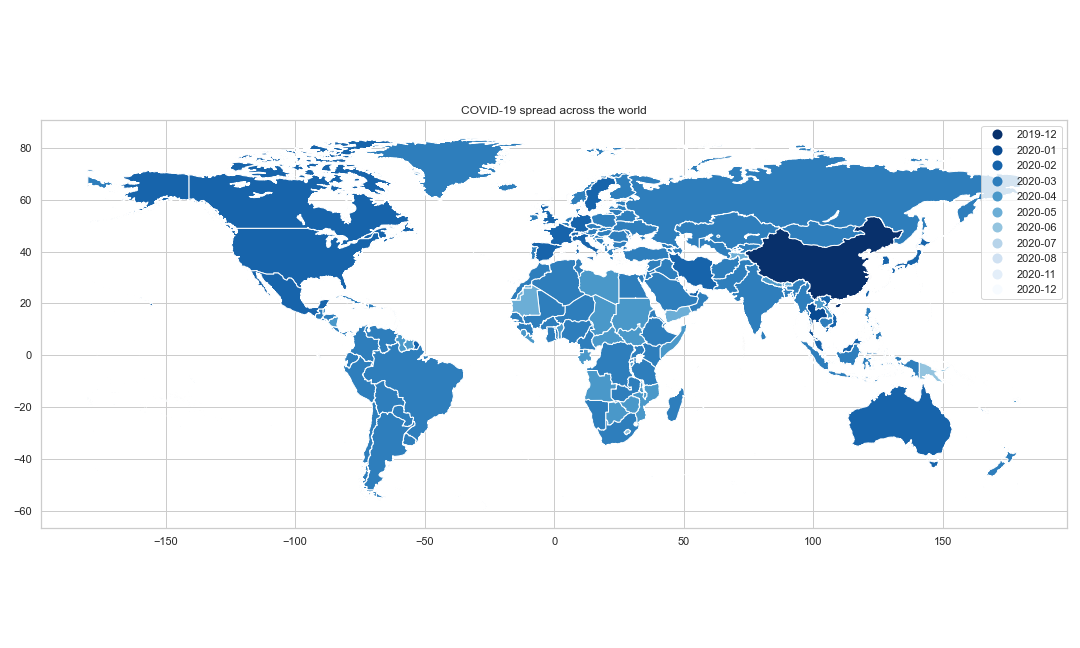
The onset of COVID-19 has led to a torrent of statistics and graphs as the virus wreaks havoc across the world. A number of initiatives have been setup to filter and centralise data across the globe. To name but a few:
-
When is a peak not a peak?
Epidemiological spread often starts slowly by infecting a small number of carriers, but quickly takes hold as these people go on to infect multiple other people. A virus that is highly contagious will have a high R0 value, meaning that each person transmits the infection to many other carriers. The infection curve rapidly increases as the virus takes hold in the population. Only as it works its way through a population will the virus eventually slow down before tapering off.
-
Web-site reorganisation
Even small amounts of data can generate many different types of graphs and results. The number of graphs is becoming too much for a single page so I’ve made a major re-organisation of the web site. Graphs are now organised into sub-categories and navigation is made easier. The blog will still continue in parallel but the graphs sections will be expanded.
 All of this using the Liquid templating language inside the Jekyll framework.
See the git repo for more details (especially the scripts in the _bin folder) and the new markdown pages.
All of this using the Liquid templating language inside the Jekyll framework.
See the git repo for more details (especially the scripts in the _bin folder) and the new markdown pages. -
Getting started with pandas and COVID-19 data
Python is a simple and elegant programming language used widely in the scientific community. There are thousands of libraries and frameworks that extend the reach of the language even further. Pandas is a data analysis framework that can be used to easily read data files then manipulate them to analyse the information. You can even plot graphs of your results. Here is a simple example. The European Centre for Disease Prevention and Control centralise data on the worldwide COVID-19 infections and deaths. You can download this in Excel format here.
-
Website moved to Jekyll
I have migrated these pages to use the Jekyll web site generator. Pages are now written in Markdown which is easier to use than HTML. I can also focus on the content instead of page layout.

subscribe via RSS