 Data Science and COVID-19
Getting started with pandas and COVID-19 data
Python is a simple and elegant programming language used widely in the scientific community. There are thousands of libraries and frameworks that extend the reach of the language even further. Pandas is a data analysis framework that can be used to easily read data files then manipulate them to analyse the information. You can even plot graphs of your results. Here is a simple example. The European Centre for Disease Prevention and Control centralise data on the worldwide COVID-19 infections and deaths. You can download this in Excel format here.
The data is a simple table with daily entries for each country:
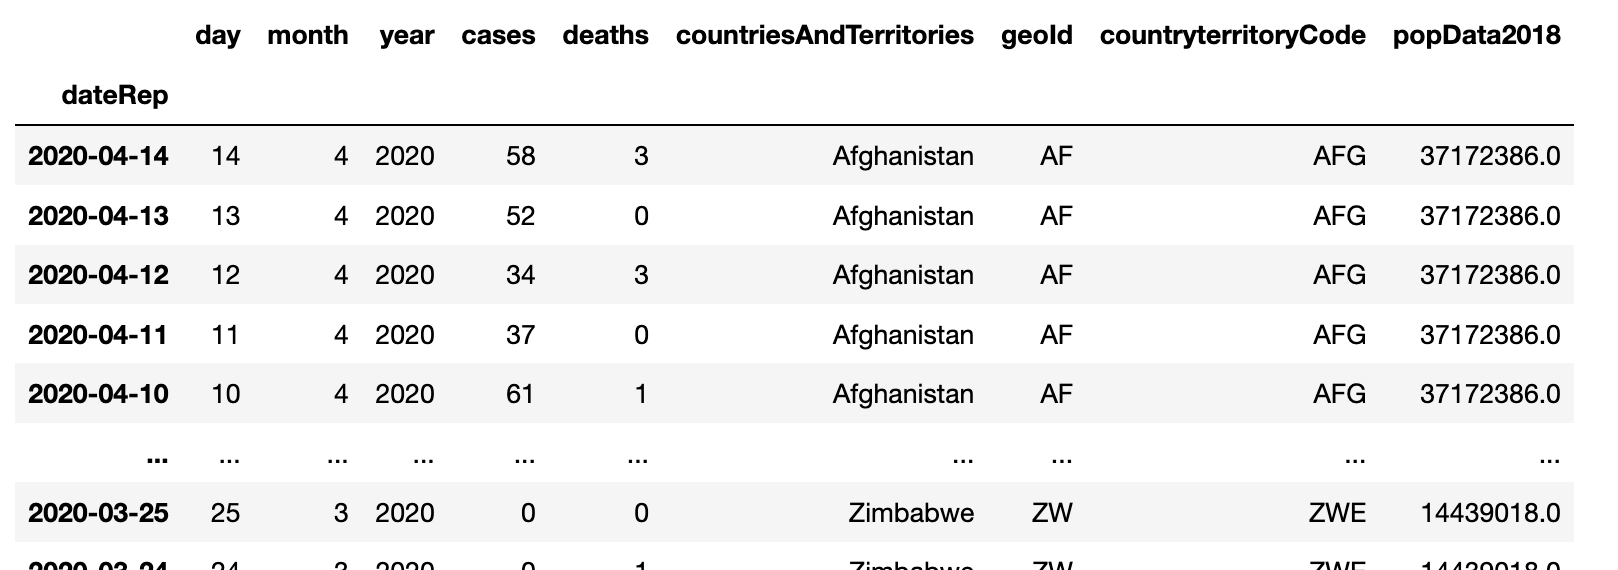
Load this into a pandas DataFrame in 1 line and print out a summary:
df = pd.read_excel("COVID-19-geographic-disbtribution-worldwide.xlsx").set_index("dateRep")
df.describe()[["cases", "deaths"]]
And this is what we get:
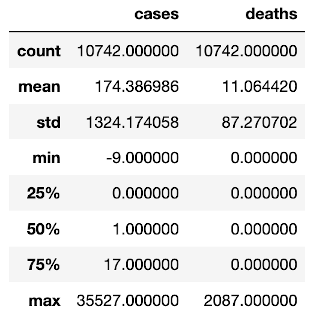
This doesn’t look much, but there is already a great deal going on. Pandas has loaded data from Excel, understood the various data types (dates etc) and built something called a DataFrame. Pandas can out of the box analyse the entire table and describe it back to us: 10742 data entries (count), a maximum of 2087 deaths on any given day (unfortunately recorded in the US on 11/04/2020), and 35527 new cases recorded in any country (in the US also on 11/04/2020). We even have other metrics like standard deviation, minimum values, percentiles, arithmetic means etc.
This is the beginning of what pandas DataFrames can do. In future posts we will continue to unlock the power of pandas.