 Data Science and COVID-19
When is a peak not a peak?
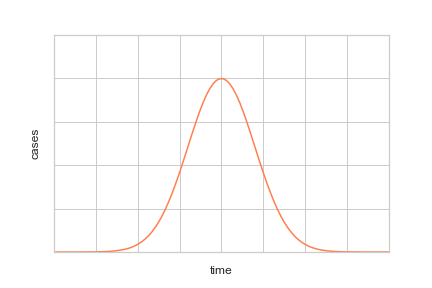
Epidemiological spread often starts slowly by infecting a small number of carriers, but quickly takes hold as these people go on to infect multiple other people. A virus that is highly contagious will have a high R0 value, meaning that each person transmits the infection to many other carriers. The infection curve rapidly increases as the virus takes hold in the population. Only as it works its way through a population will the virus eventually slow down before tapering off.
If we plot the curve of new COVID-19 cases each day, this would show a familiar bell curve. Infections rise quickly, reaching a peak, then start to slow down until they eventually tend to zero.
Many of the policy decisions seen across the world depend on identifying where a particular country lies on this curve. Countries on the far left of the curve are early in the life cycle of the virus: some cases will have been identified but the country is yet to see widespread infection. As the virus accelerates, countries put in place measures to control the spread: social distancing, hygiene precautions and perhaps some level of isolation and lockdown.
But these measures have significant impacts on the daily lives of millions of people and incur considerable costs. At what point does a government start to relax these measures? One pre-condition is to ensure the nation has passed the peak infection rate before isolation measures can be revisited. But where is this peak? This is simple to identify in theory but often more difficult in practice. Each drop in daily cases is greeted by calls to end the lockdown - the country is passed the worse and things can return to normal. But we will see this is rarely the case.
Take the example of Austria: a European country that is generally seen to have acted relatively quickly and kept the virus under control. Virus infections did indeed rise quickly before tapering off. But a closer look at the infection curve shows a much more chaotic picture. There were multiple points in the infection curve that suggested the peak had already been crossed, yet subsequently proved to be local peaks:
- 20/03/2020: 550 new cases
- 24/03/2020: 855 new cases
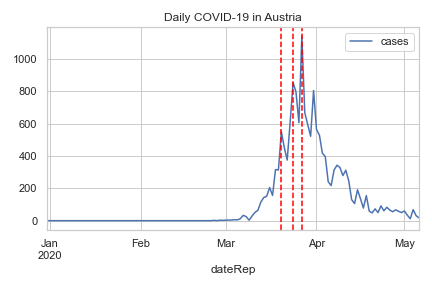
In fact, the peak actually occurred on 27/03/2020 with 1141 new cases in a single day, 1 week after the initial drop. If we generate a 7-day rolling average, the curve is smoother and the peak is more obvious.
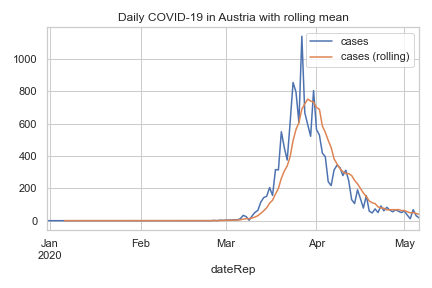
In all cases, these peaks are only obvious with hindsight. Scientific experts and policy advisers have urged caution when predicting the peak of the infection and instead prefer to track trends over a longer period. This underlines the challenges in defining public policy in a dynamic, fast-moving situation such as that presented by COVID-19.